The Stipso Living Infographic toolkit was an online application for creating highly graphical and interactive infographics which served as live surveys that users could contribute to.
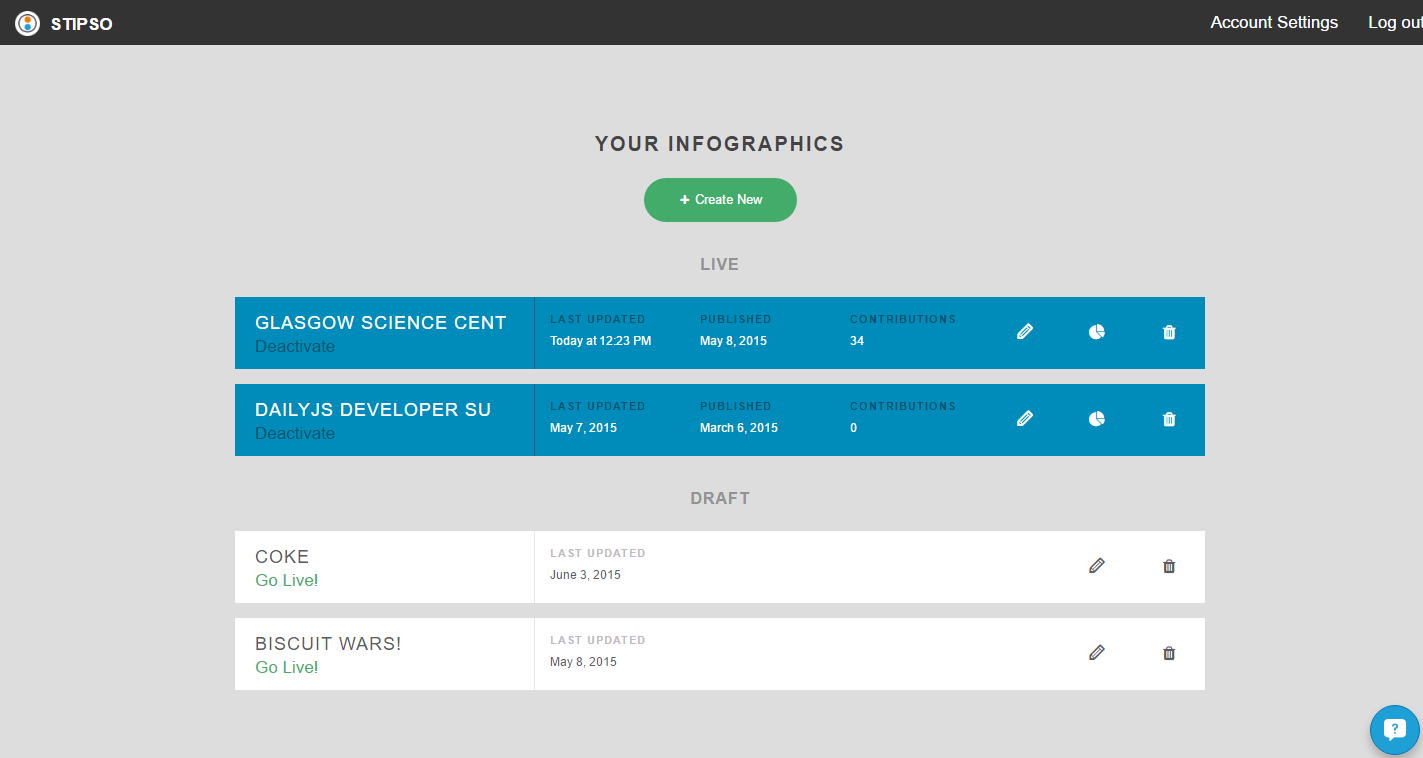
The home page (above) shows an account with two surveys 'live' i.e. actually being contributed and available publicly on the internet and two that are in 'draft' status i.e. currently being built and not yet published. From here new surveys can be created, existing surveys edited or deleted, and analytics for each survey can be accessed. Live surveys show a headline number of contributors.
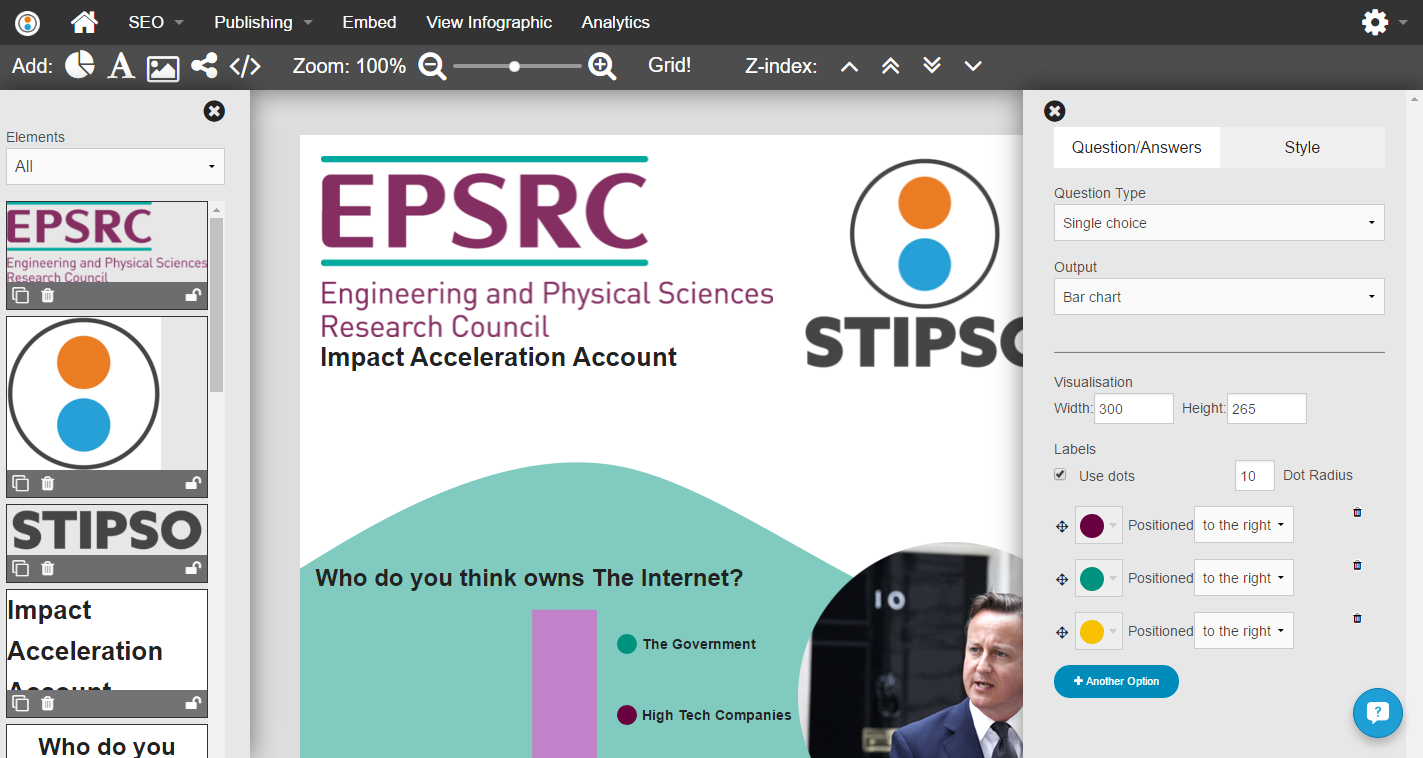
The editor interface (above) shows the infographic canvas in the centre with two dismissable panels at the left and right. Above the canvas are the menu bar at the top which primarily deals with meta information about the Living Infographic, and the toolbar beneath which provides tools for editing the survey.
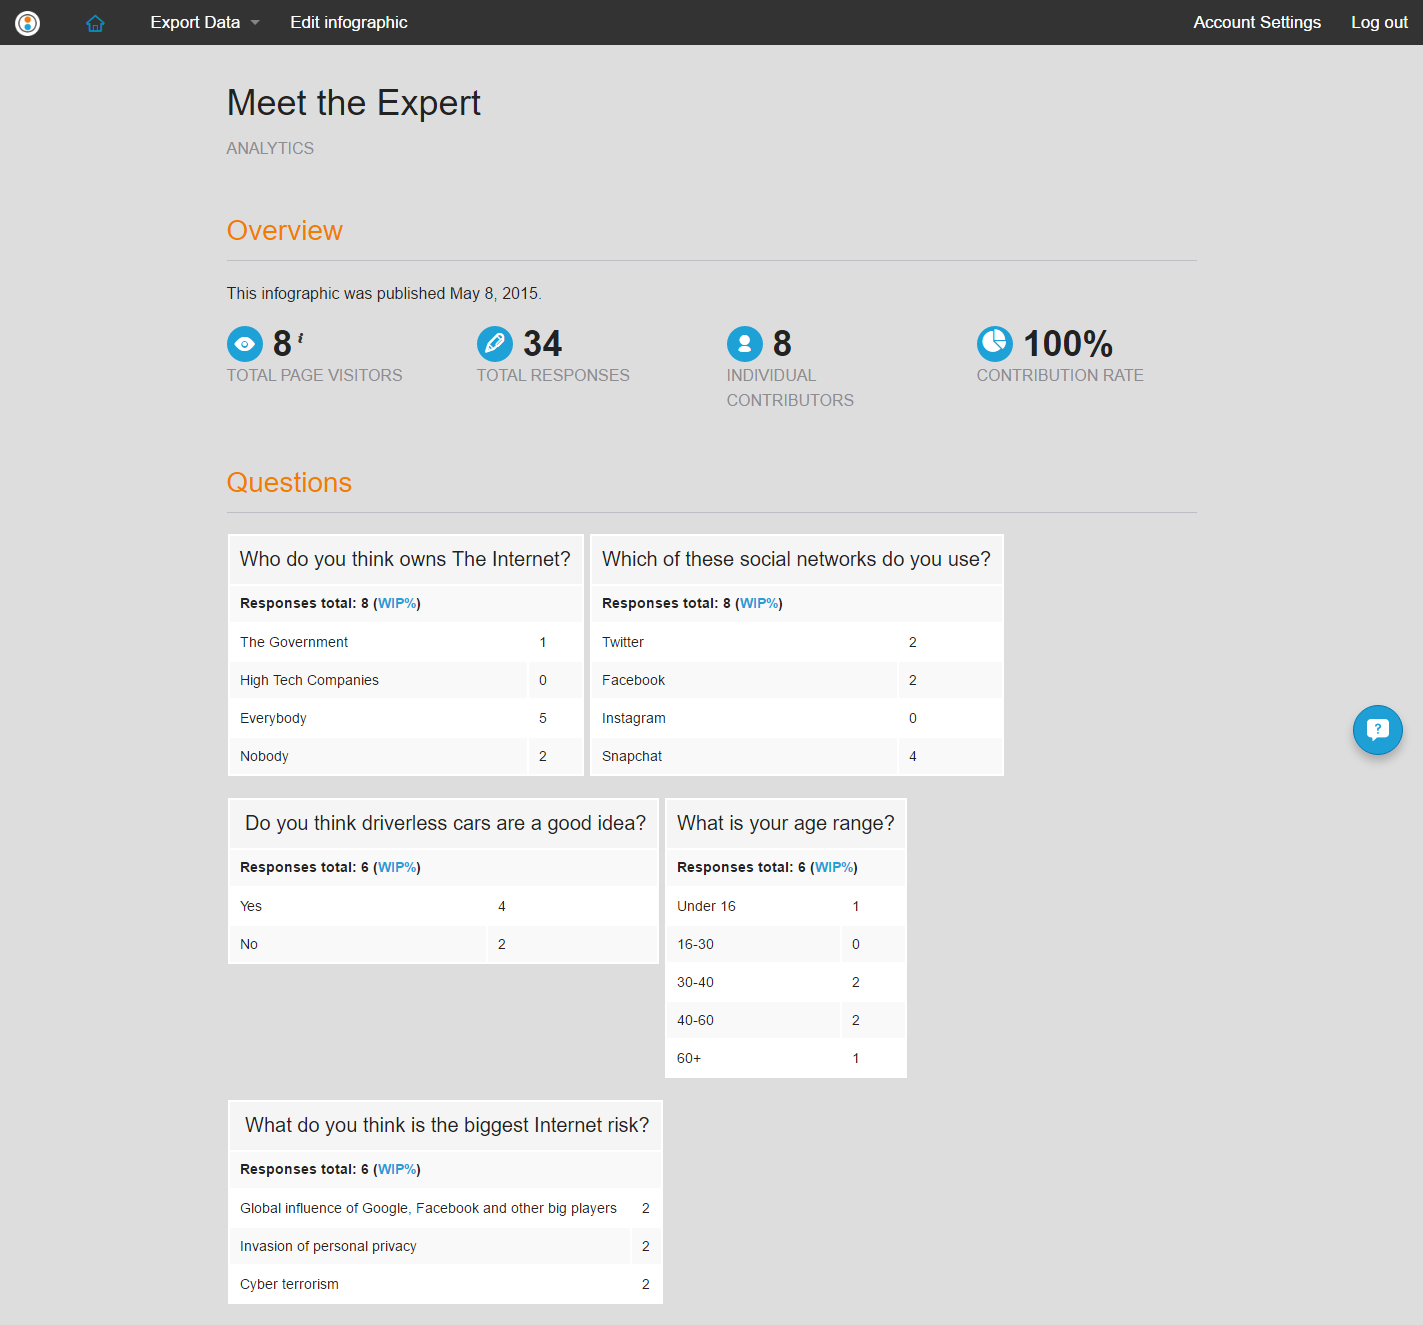
The analytics space (above) shows the user the summary analytics of the contributions to date and allows the raw data to be export in a number of delimited formats for further analysis in another progrm such as Microsoft Excel or to load into a an analytics language such as R.
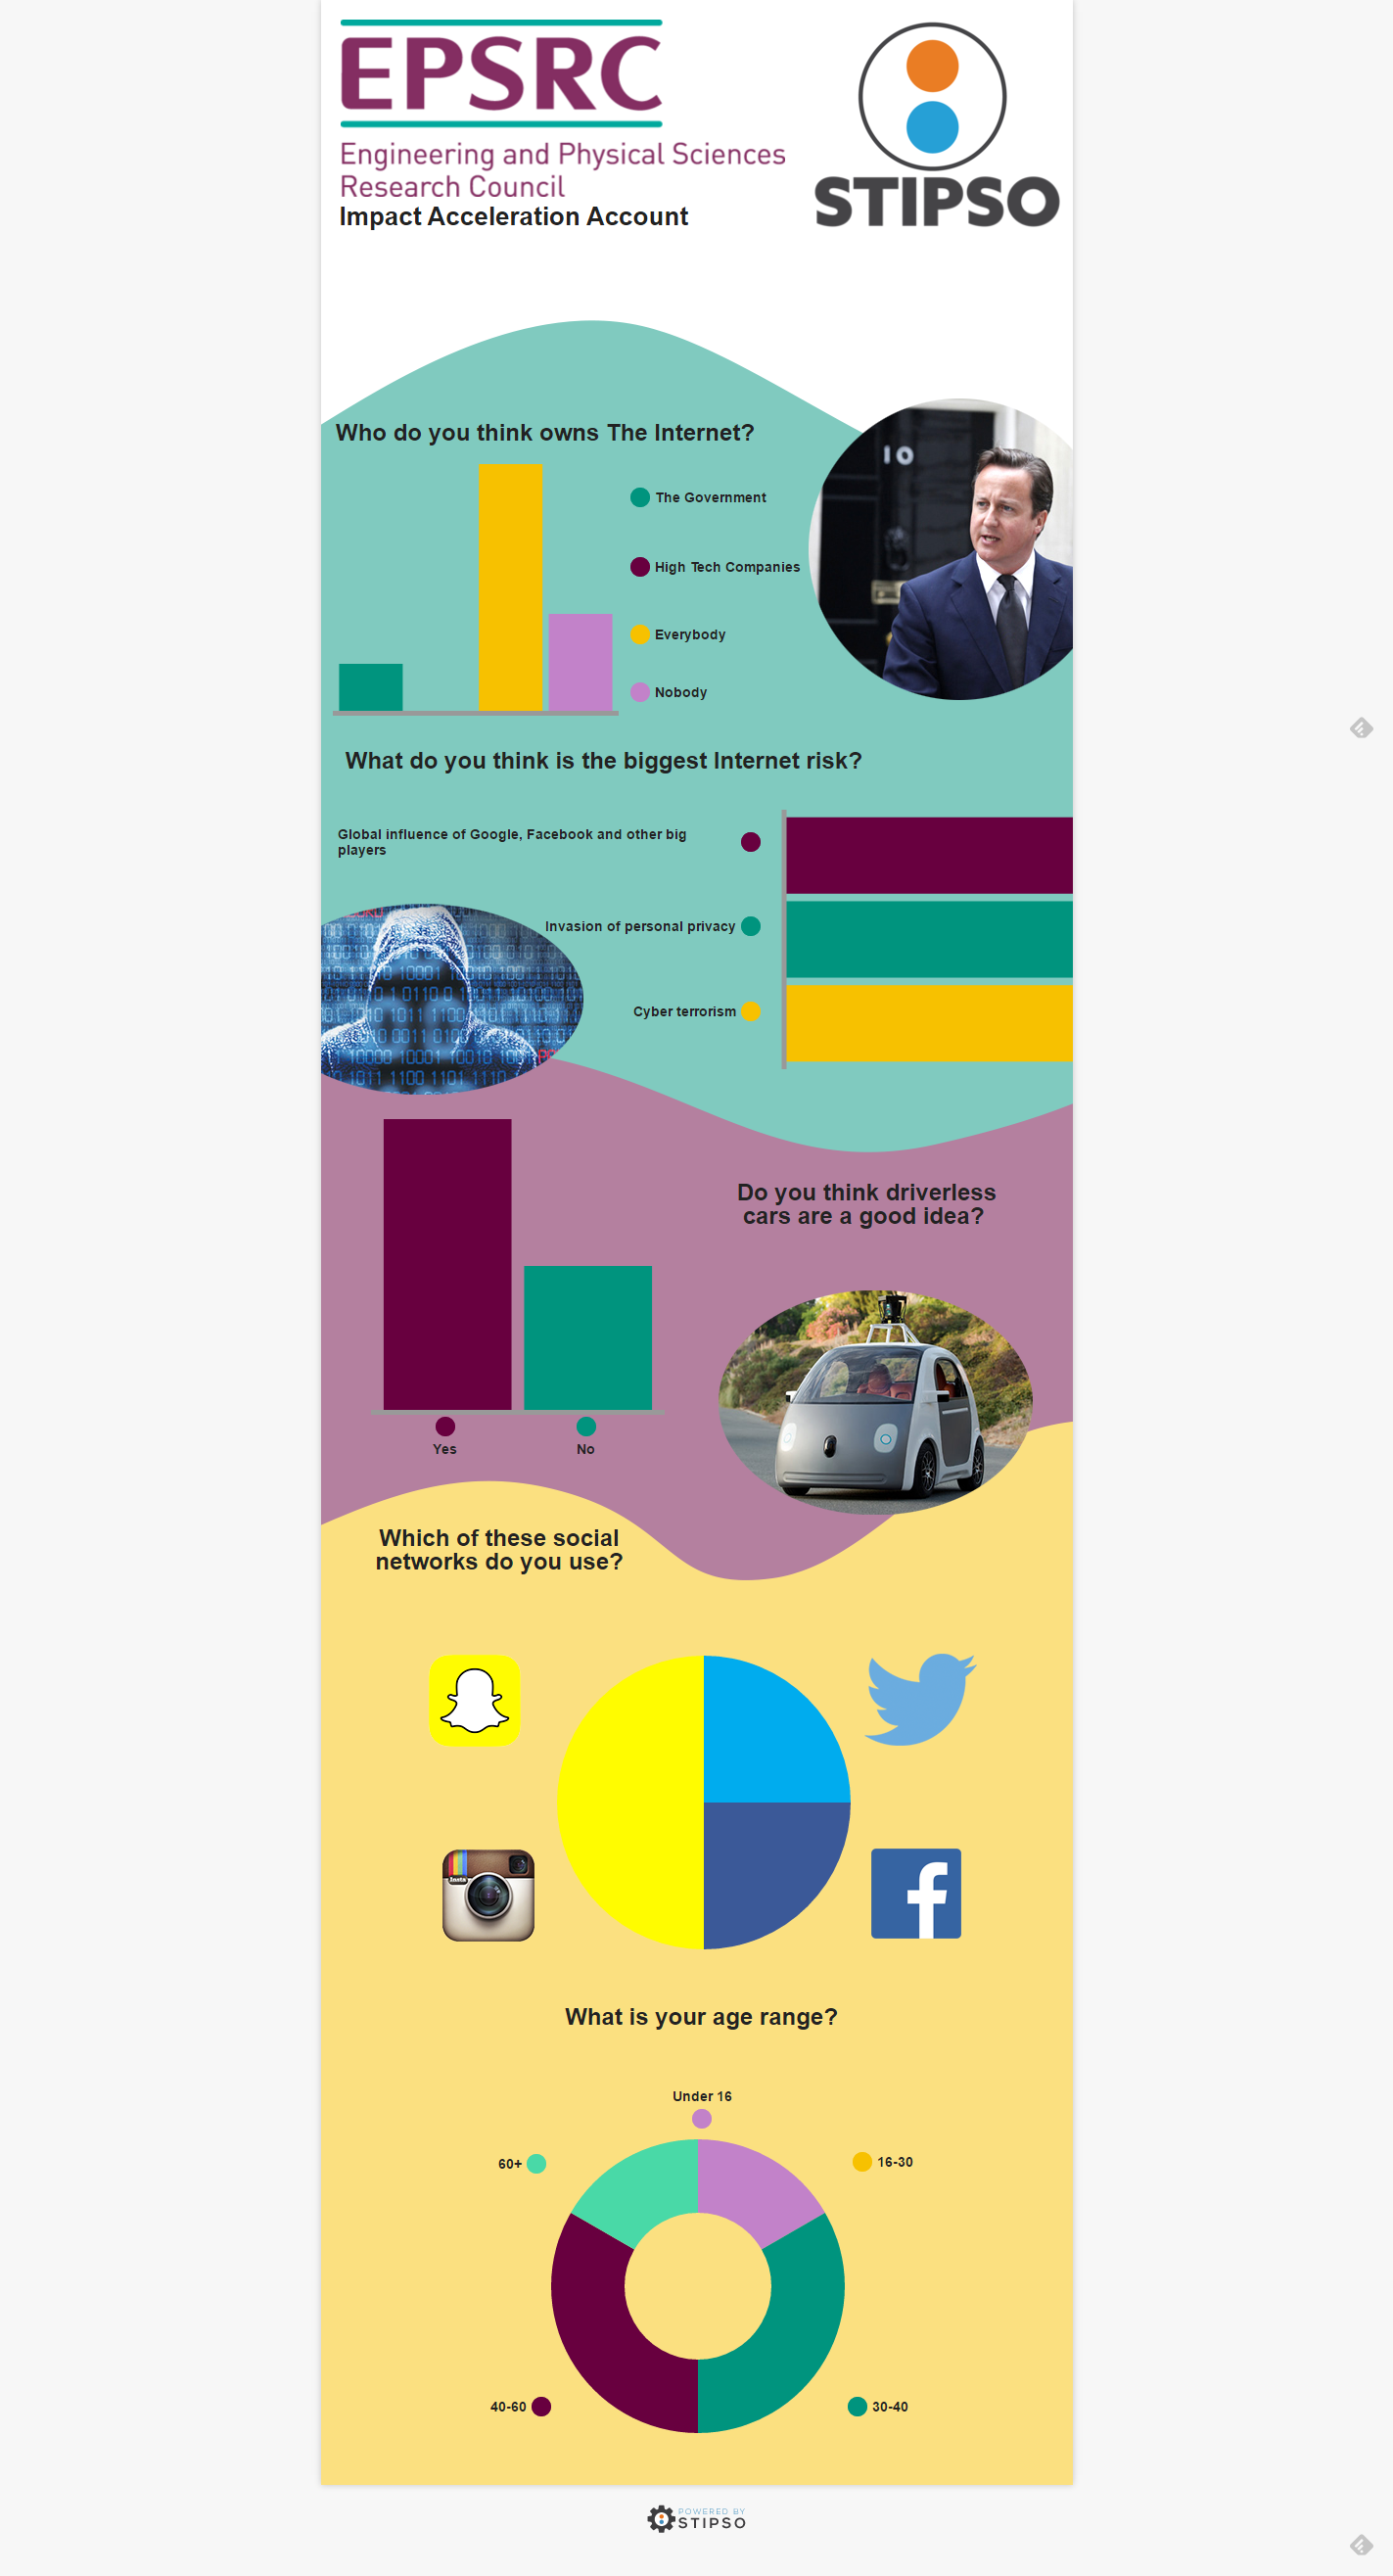
A sample finsihed Living Infographic (above)